China AI Vision: Count False Rejects and Missed Defects
Turn a machine-vision accuracy score into batch-level counts of false rejects, missed defects and parts sent to hold, using a worked production-mix example.
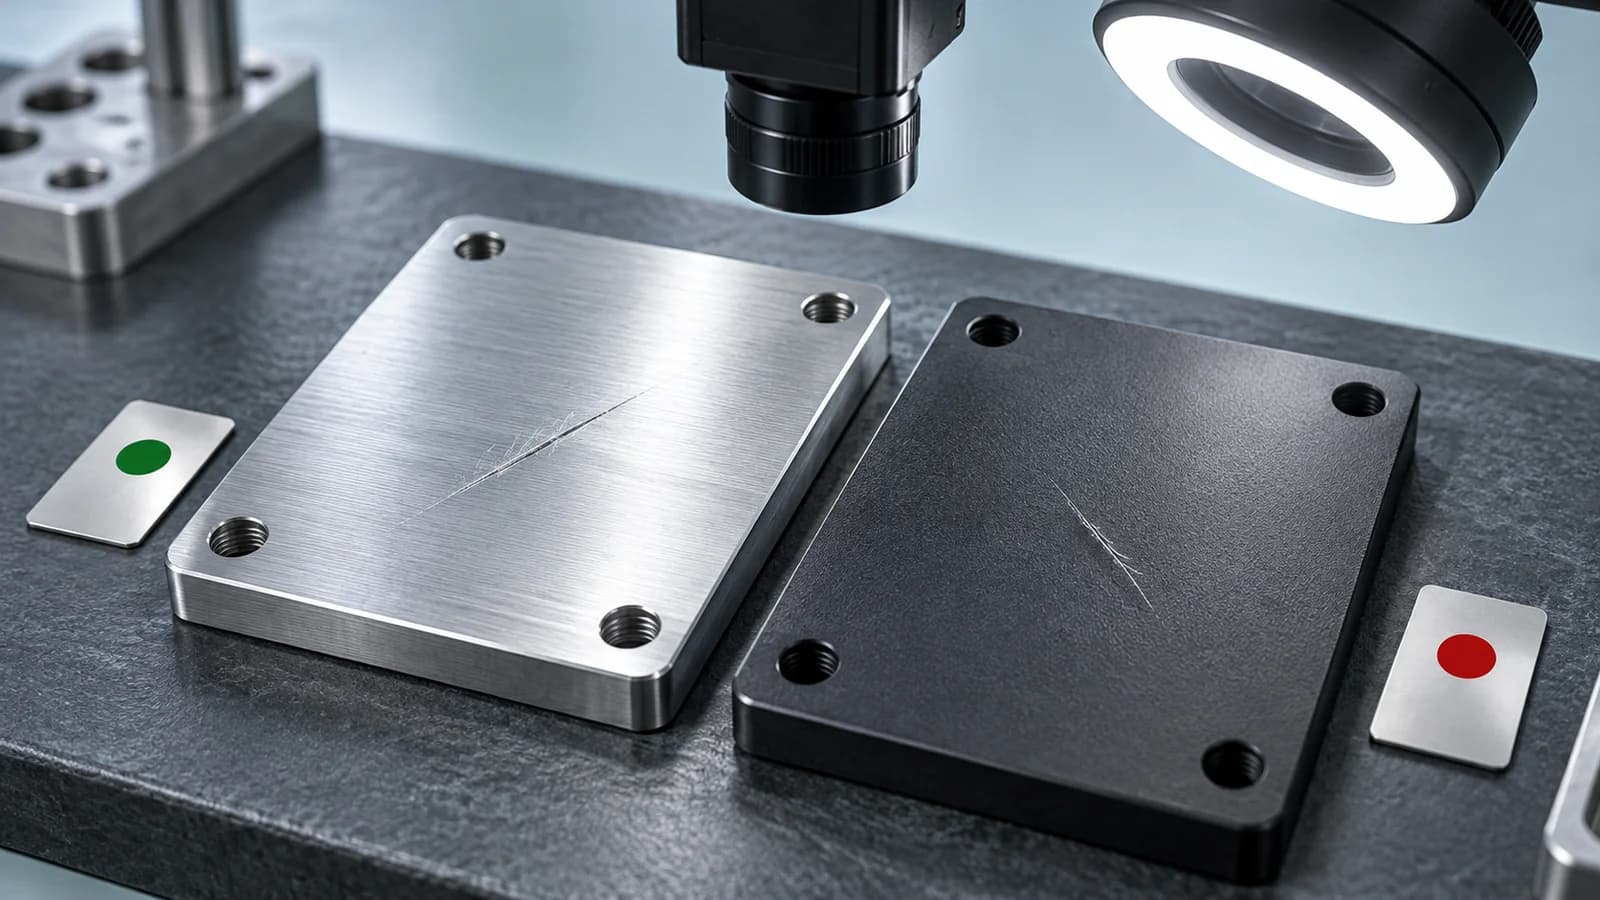
A factory inspection model can report higher overall accuracy while sending mostly acceptable parts to reinspection. To evaluate it, ask for the counts of missed defects and false rejects, the population behind each rate, and the expected mix of acceptable and defective parts on your line.
During a China machine-vision visit, turn the demonstration's percentage into a routing question: how many parts would this configuration hold, and how many defects would it pass? Those counts connect the model to the work of quality engineers and operators.
Record all four outcomes
Agree the defect definition before running the test. Use an independent inspection or adjudication process to establish the reference label; the model's own decision cannot establish whether a part is defective.
For each evaluated part, record the reference label and the model's proposed route. A false reject is an acceptable part routed to hold or reinspection. A missed defect is a defective part routed to pass. A hold decision does not necessarily mean the part is scrapped: trace what the operator actually does next.
MEASURE 2.5 in NIST's AI Risk Management Framework 1.0 (2023) addresses validity, reliability and documented limits on generalization beyond development conditions. That is the evaluation context for this exercise. The calculations below use assumed counts to show how the population changes the meaning of a score.
Compare an enriched test with a production mix
Suppose a demonstration set contains 100 confirmed defective parts and 100 acceptable parts. At a fixed model version and decision threshold, the model catches 90 of the defects and correctly passes 98 of the acceptable parts. Its overall accuracy is 188 / 200 = 94%.
Now consider a hypothetical production batch of 10,000 parts containing 100 defects and 9,900 acceptable parts. For this calculation, assume the same 90% defect-detection rate and 2% false-reject rate apply. This transfer is an assumption to test, rather than evidence established by the demonstration.
| Reference condition | Model routes to hold | Model routes to pass | Total |
|---|---|---|---|
| Defective | 90 | 10 | 100 |
| Acceptable | 198 | 9,702 | 9,900 |
| Total | 288 | 9,712 | 10,000 |
The model correctly classifies 90 + 9,702 = 9,792 parts, giving 97.92% overall accuracy. The higher score comes from the changed population mix; neither conditional error rate improved.
Of the 288 parts routed to hold, only 90 / 288 = 31.25% are defective. The other 198 are acceptable parts requiring whatever reinspection or disposition the process specifies. Meanwhile, ten defective parts have been routed to pass.
An enriched defect set can help examine failure types. Keep its composition visible, and report its results separately from a representative operating sample. Do not pool the two sets into one headline score and treat that score as the expected line result.
Give every rate its denominator
Ask the supplier to preserve counts alongside percentages. A defect-detection rate uses the confirmed defective population. A false-reject rate uses the confirmed acceptable population. The fraction of held parts that are truly defective uses a third denominator: all parts routed to hold.
Those three measures answer different questions. Confusing them can turn a good detection result into an unrealistic expectation about the reinspection workload. Record sample size and uncertainty too; an observed zero misses in a small test does not establish a zero-miss operating process.
Keep unreadable images, camera failures and uncertain reference labels visible as separate outcomes, with their actual routing rule. Excluding those cases silently makes the displayed result describe a narrower process than the one the plant must operate.
Compare thresholds against both consequences
A proposed threshold change needs a fresh four-outcome table. Report false rejects and missed defects together, by defect category where the consequences differ. An improvement in reinspection volume can come with more missed defects, and the importance of that exchange depends on the product and its acceptance requirements.
For a pilot, agree the permitted miss rate and the hold process with the responsible quality owner before the final evaluation. Select settings using development data, then evaluate the frozen configuration on a separately held set. Preserve the model version, threshold, camera settings, labeling policy and observation period with the result.
Check the physical route as well as the classifier. A correctly flagged part still needs to reach the hold location, retain its identity and receive an authorized disposition. Count actual holds, releases and unresolved parts instead of assuming that every positive prediction became a completed inspection action.
Leave with a batch-level acceptance question
Request a redacted record containing the four outcome counts, exclusions, defect categories, frozen settings and disposition results. Use it to specify what remains unproven for your own line: the operating defect mix, a particular failure category, the routing mechanism or the acceptable trade-off between misses and false rejects.
Use the production-changeover guide when the material, lighting or product changes. Scope an industry-focused China AI program around the sample population and quality decision your team needs to examine.